by Barbara Barron | Posted October 21st, 2026 | Subscribe to this newsletter

Here you are, giving your monthly development report and sharing a dashboard intended to give trustees a good sense of how things are going with, say, your annual fund.
Suddenly, a trustee asks a question that is well-intended but is either totally off subject or reveals a lack of understanding of the data, and by extension, the strategy you’re executing to meet the goal.
Been there. It’s frustrating for everyone.
From there, it’s easy to find ourselves down a rabbit hole, responding to (deflecting? defending?) unhelpful “suggestions” about things like alumni participation.
It’s common – but as I discussed recently with Kaitlin Windle of Apte.com – avoidable if we design dashboards that report on agreed upon KPIs that are most reliable towards meeting our goals. Notice the agreed upon part. That’s where we initially get off track.
Kaitlin’s urging is that we set those KPIs early – like at the first development committee meeting of the year. Or, even better, during the Board retreat.
What are the KPIs we’re going to track and report on that are based on our goals?
Once we’ve decided that, stick with it. Report on those consistently, at every meeting, with every dashboard. Simple. Replicable. And at a high level! That way trustees can stay focused on making strategic decisions.
I interviewed Kaitlin after sitting in on a conference session she and Mattingly Messina offered at SAIS in Chattanooga last spring. There were some real gems from that session. I wanted to get a refresh on them so I could share them with you.
Have you subscribed to this newsletter yet? It only takes a minute.
My discussion with Kaitlin
Kaitlin started her company, Apte.com, after working in investment banking and private equity. Wanting a more reasonable lifestyle, she moved into development work. Her first gig was at the Aspen Ballet, since she was a dancer herself. Once there, she immediately saw little strategy at work, so she mapped her own graphs to visualize the data. Once they could see the donor data, they raised more money in six months than in the twenty previous years. Bingo!
Kaitlin went to her next challenge: CFO at an art school, where she encountered the same problem. She deployed a similar solution. Results? They raised the highest surplus the school had in twenty years – in just six months.
Sounding like a miracle drug? I know! She started Apte.com in 2023 and now has 14 people on the team, working with schools and some other nonprofits creating custom data models.
Lots to unpack here so I’ll focus this article on two key metrics she recommends be part of our dashboards. The first is “pace”. Second is giving levels.
Pace. This metric measures where we are, as a percentage to goal, compared with the previous year. On this date last year, what percentage of our goal had we secured and what is our percentage to goal on this date?
The percentage to goal is the key aspect. This gives a much clearer view of whether we will meet (or exceed) the goal by the end of the fiscal year. Pace works because it is not affected by any increase in the goal from last year since it is the “percentage to goal.” We know that hitting 80% of the goal by the end of December is a solid indication that we’re in good shape. Pace is the metric that tells us if we’re indeed on target. And if not, we have a six-month window in which to deploy a strategy to get there.
Giving levels. I’ve written on this topic recently. Kristin’s advice is to include this in your monthly dashboard because it keeps the focus on leadership giving, which is where we want trustees’ attention to stay.
Determine what percentage of the goal is coming from leadership level giving (whatever gift amount that is for your school). We used to see that 80% came from our top donors. We all know it’s now closer to 90-95%. That’s job one: secure those gifts first.
But next is what Kaitlin called “finding where the juice to squeeze lies.” She means that group of donors in the middle of your giving levels. Often the majority of leadership givers are there. How long have they been? Who among them might you focus on and ask to increase? My previous piece about how to show the math and the thinking about these increases is here. A discussion about this KPI and the strategy you are employing to reach it is worth trustees’ time.
And one more action and related metric that is simply not worth it is faculty/staff giving. The ROI is terrible. The time it takes to secure 100% participation from the hardest working people in the school could be invested in finding new leaders. Then there’s the risk we take to the relationships with our valued colleagues by pestering people to make a token gift.
Wouldn’t we prefer that instead, these good folks are willing respond to our requests for help with stewardship stories and examples of gifts in action? I would.
Finally, think about what’s required in the business office to process payroll deductions of $1 twice a month? Talk about bad ROI! Let’s stop. Let’s focus on what makes a real difference and give these folks a break.
Metrics reflect what we care about. Whether we realize it or not. What we focus on increases. Let’s use smart metrics to guide work that matters and help our trustees spend their valuable time and energy on strategy. Works for everyone.
Thanks, Kaitlin!
And as always, thank you reader, for everything you’re doing.
Kaitlin Windle can be reached through her company website: apte.com or on LinkedIn: https://www.linkedin.com/in/kaitlin-windle
Barbara Barron
[email protected]
Share this post:
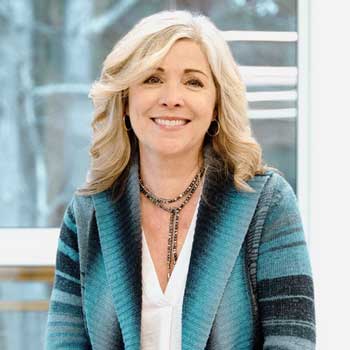
BARBARA BARRON is one of the most respected and highly sought-after independent advancement professionals in the country, having worked with dozens of schools in every corner of the United States.
She has raised over $20 million for schools where she served as the Director of Development. Barbara is a New York Times bestselling author, speaker, and presenter who currently advises dozens of schools in various capacities. She is considered a thought leader in the world of advancement, with her writing widely shared by professionals in development offices worldwide.
More Advancement Articles
- How Can We Build a Better Dashboard?

- How Can We Make the Advancement Office a Great Place to Work?

- How Can You Partner With Your Admissions Office Without Stepping on Toes?

- How Can We Increase Our Giving Levels?

- How the 2026 Mid-Term Elections May Impact Our Fundraising & What We Can Do About It

- Success Story #4